
Profiling PHP Applications with XDebug (using ownCloud as an Example)
XDebug for PHP is a PHP extension that enables you (amongst other things) to create (KCachegrind compatible) profiling files. I'm showing here how we can use those to analyze ownCloud's performance.
Install XDebug for your PHP version, then add in php.ini:
xdebug.profiler_enable = On
xdebug.profiler_output_name = "cachegrind.out.%s"
xdebug.profiler_append = 1
With the append parameter we can have the profiling data appended to the file so we can see how it changes over time (values going up or down).
Now when clicking around in your ownCloud installation, you'd see those files getting created (for me in /var/tmp, usually in the directory where PHP stores its sessions):
-rw-r--r--  1 guruz  guruz   509K Aug 14 18:55 cachegrind.out._www_owncloud5_cron_php
-rw-r--r--  1 guruz  guruz    16M Aug 14 18:55 cachegrind.out._www_owncloud5_index_php
-rw-r--r--  1 guruz  guruz   1.1M Aug 14 18:55 cachegrind.out._www_owncloud5_remote_php
While you can use KCachegrind to look at the profiling output, there is also a way to have a look with the web-based tool Webgrind. I'm using this one since it is cross-platform.
Drop Webgrind into your web root, e.g. inside your ownCloud directory:
git clone https://github.com/jokkedk/webgrind.git webgrind(Please note that it makes more sense to deploy webgrind somewhere else, since the above setting in the php.ini will enable also the profiling of Webgrind itself which will make it sloooooow).
Then you can visit /webgrind of your HTTP server, select one of the files and have a look at its numbers. The Total Inclusive Cost is the relevant number to look at, it displays how much time a function takes including all the things it calls.
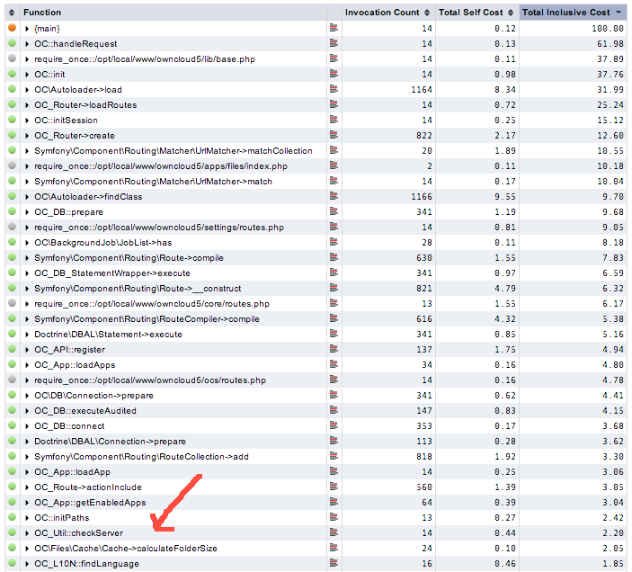
In this example, I'm looking at the index.php trace (in cachegrind.out._www_owncloud5_index_php) where I want to optimize checkServer() in OC_Util. I see in the trace (and in the code) that this function is called for every request.
While it is not a super expensive function compared to the other ones, optimizing a few of those would add up!
This is before optimizing:

The goal of the checkServer() function is to perform a sanity test on the server configuration and bail out if there is a problem. We decided that it is enough to perform this sanity test once per session.
We can therefore store the result of this function in $_SESSION like you can see in this pull request on GitHub (ownCloud is using a wrapper called \OC::$session).
After applying this change and then clicking some more inside
ownCloud's webinterface, we should see the cost inside Webgrind for
checkServer() going down :-)
(Note that the function might even go away from the trace since by default Webgrind
only shows 90% of the function ordered by expensiveness)
This is after optimizing:

Since optimizing is often about tradeoffs, in this case our session file will grow some bytes (checkServer_suceeded|b:1) but since it is loaded and parsed anyway for other values, we've settled that this is probably faster than what the checkServer() does currently.
Woboq is a software company that specializes in development and consulting around Qt and C++. Hire us!
If you like this blog and want to read similar articles, consider subscribing via our RSS feed (Via Google Feedburner, Privacy Policy), by e-mail (Via Google Feedburner, Privacy Policy) or follow us on twitter or add us on G+.
![]()
![]()
![]()
![]()
![]()
Article posted by Markus Goetz on 15 August 2013
Click to subscribe via RSS or e-mail on Google Feedburner. (external service).
Click for the privacy policy of Google Feedburner.
Google Analytics Tracking Opt-Out
Loading comments embeds an external widget from disqus.com.
Check disqus privacy policy for more information.